Setting up a simple visualizer for the Visual Studio debugger is all very well but sometimes it’s easier to use something other than the simple language that autoexp.dat exposes.
For instance it would be feasible to write a visualizer to turn something that turned an integer into the human readable version of the OLE date it represents. But it would be quite painful.
The lo-tech way to handle this to load Excel, type in the value and then format as a date. That is a pain. Looking at our internal development wiki shows three utilities that also do this with various user interfaces. But wouldn’t it be nicer to be able to see the value directly within the debugger.
Given the extension available for the Visual Studio debugger and WinDBG it would be surprising if this was impossible, what’s annoying is how scantily the information on doing this is made available.
Most of the information is buried in the EEAddin sample in C:\Program Files\Microsoft Visual Studio 9.0\Samples\1033\AllVCLanguageSamples.zip. Within that archive the sample is at C++\Debugging\EEaddin.
There’s two parts to writing these visualizers. The first is writing the extension dll in C or C++, the second updating AutoExp.dat to use it.
Writing the code
The visualizer lives in a standard Windows dll and have a specific function signature. So for our example we define our visualization function.
#ifdef __cplusplus
extern "C" {
#endif

MYDBGVIEW_API HRESULT WINAPI oleDate(DWORD dwAddress,
                                     DEBUGHELPER *pHelper,
                                     int nBase,
                                     BOOL bUniStrings,
                                     char *pResult,
                                     size_t max,
                                     DWORD reserved);
#ifdef __cplusplus
} // extern "C"
#endif
Where the documentation for the arguments is:
| dwAddress | The address of the variable being inspected. |
| pHelper | Pointer to a helper structure for accessing debugger information. |
| nBase | Base to display any numeric values in. |
| bUniStrings | Whether to use unicode strings (can't generally be ignored). |
| pResults | Buffer to write the representation into. |
| max | Size of the pResults buffer |
| reserved | Reserved for future use, can be ignored. |
(Note the WINAPI definition which ensures that the function uses the __stdcall convention. The examples in EEAddin don’t seem to do this but it is required otherwise you will cause access violations inside Visual Studio.)
namespace
{
    template<typename T> HRESULT get_type(DEBUGHELPER *pHelper,
                                                DWORD dwAddress,
                                                T& value)
    {
        DWORDLONG qwRealAddress;
        DWORD dwGot;

        HRESULT hr = S_OK;
        if (pHelper->dwVersion < 0x20000)
        {
           // Visual C++ 6.0 version
           qwRealAddress = dwAddress;
           hr = pHelper->ReadDebuggeeMemory(pHelper, dwAddress,
                                            sizeof(T), &value, &dwGot);
        }
        else
        {
           qwRealAddress = pHelper->GetRealAddress(pHelper);
           hr = pHelper->ReadDebuggeeMemoryEx(pHelper, qwRealAddress,
                                              sizeof(T), &value, &dwGot);
        }

        if (hr != S_OK)
            return E_FAIL;
        if (sizeof(T) != dwGot)
            return E_FAIL;

        return S_OK;
    }
}

MyDBGVIEW_API HRESULT WINAPI oleDate(DWORD dwAddress,
                                     DEBUGHELPER *pHelper,
                                     int nBase,
                                     BOOL bUniStrings,
                                     char *pResult,
                                     size_t max,
                                     DWORD reserved)
{
    COleDateTime dt;

    HRESULT hr = get_type(pHelper, dwAddress, dt);
    if (SUCCEEDED(hr))
    {
        CString str = dt.Format();
        strncpy_s(pResult, max, str.GetString(), str.GetLength());
        pResult[max-1] = 0;
    }
    return hr;
}
Finally you’ll want to an a module definition file to the DLL to ensure that name that’s exported is easily referenced.
EXPORTS
	oleDate
Updating AutoExp.dat
With the code built the final step is update Studio’s AutoExp.dat file (in the Common7\Packages\Debugger directory of the installation) to point to the DLL and function name that you want to use for that type.
ATL::COleDateTime=$ADDIN(D:\Code\mydbgview\Release\mydbgview.dll,oleDate)
The Result
So what do we get out of all of this? Well without the visualizer if you inspect a COleDateTime structure in the debugger you get something like this:
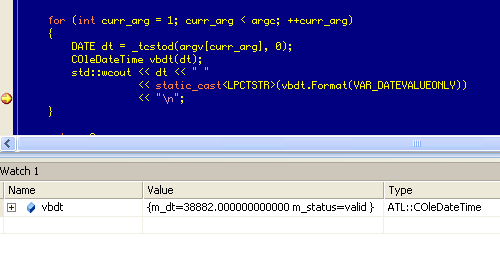
With the visualizer add this becomes:

Further Information
Josh Poley’s MSDN blog article “Custom Debugger Auto Expansion Tips” is the only worthwhile article I’ve found on this stuff.